CORRELATION GUIDE / VERSION 1
Refrigerant-side single-phase friction-factor correlations
Explains website options, friction-factor definitions, applicability ranges, and the relationship between explicit correlations and the Colebrook reference.
The current solver exposes 14 single-phase pressure-drop options. The reference table lists 15 literature correlations. Wood (1966) is unavailable because it degenerates to a zero friction factor at ε/D=0; three other correlations remain reference-only because their applicability ranges are unavailable.
1. Options available in the current solver
| Solver option | Implementation ID |
|---|
2. Quick comparison of literature correlations
Ranks follow the current source compilation and have not yet been independently recomputed by this website on a common grid. The correlations below are reference material and are not necessarily available in Solver Settings.
| Rank | Correlation | Formula summary | Published range |
|---|
3. History, definitions, and laminar-flow basis
Single-phase pipe-flow friction factors developed from experimental pressure-drop laws into dimensionless definitions and engineering correlations. The Hagen–Poiseuille relation established the basis for fully developed laminar pipe flow; the work of Weisbach and Darcy led to the modern Darcy–Weisbach pressure-drop form; Fanning established another widely used coefficient convention. Modern literature must therefore distinguish Darcy and Fanning friction factors.
Δp = f_D (L/D) (ρu²/2)This guide and the Moody diagram use the Darcy friction factor.
f_D = 4f_FAlways confirm which convention a paper or software package uses.
Fully developed laminar flow in a circular tube
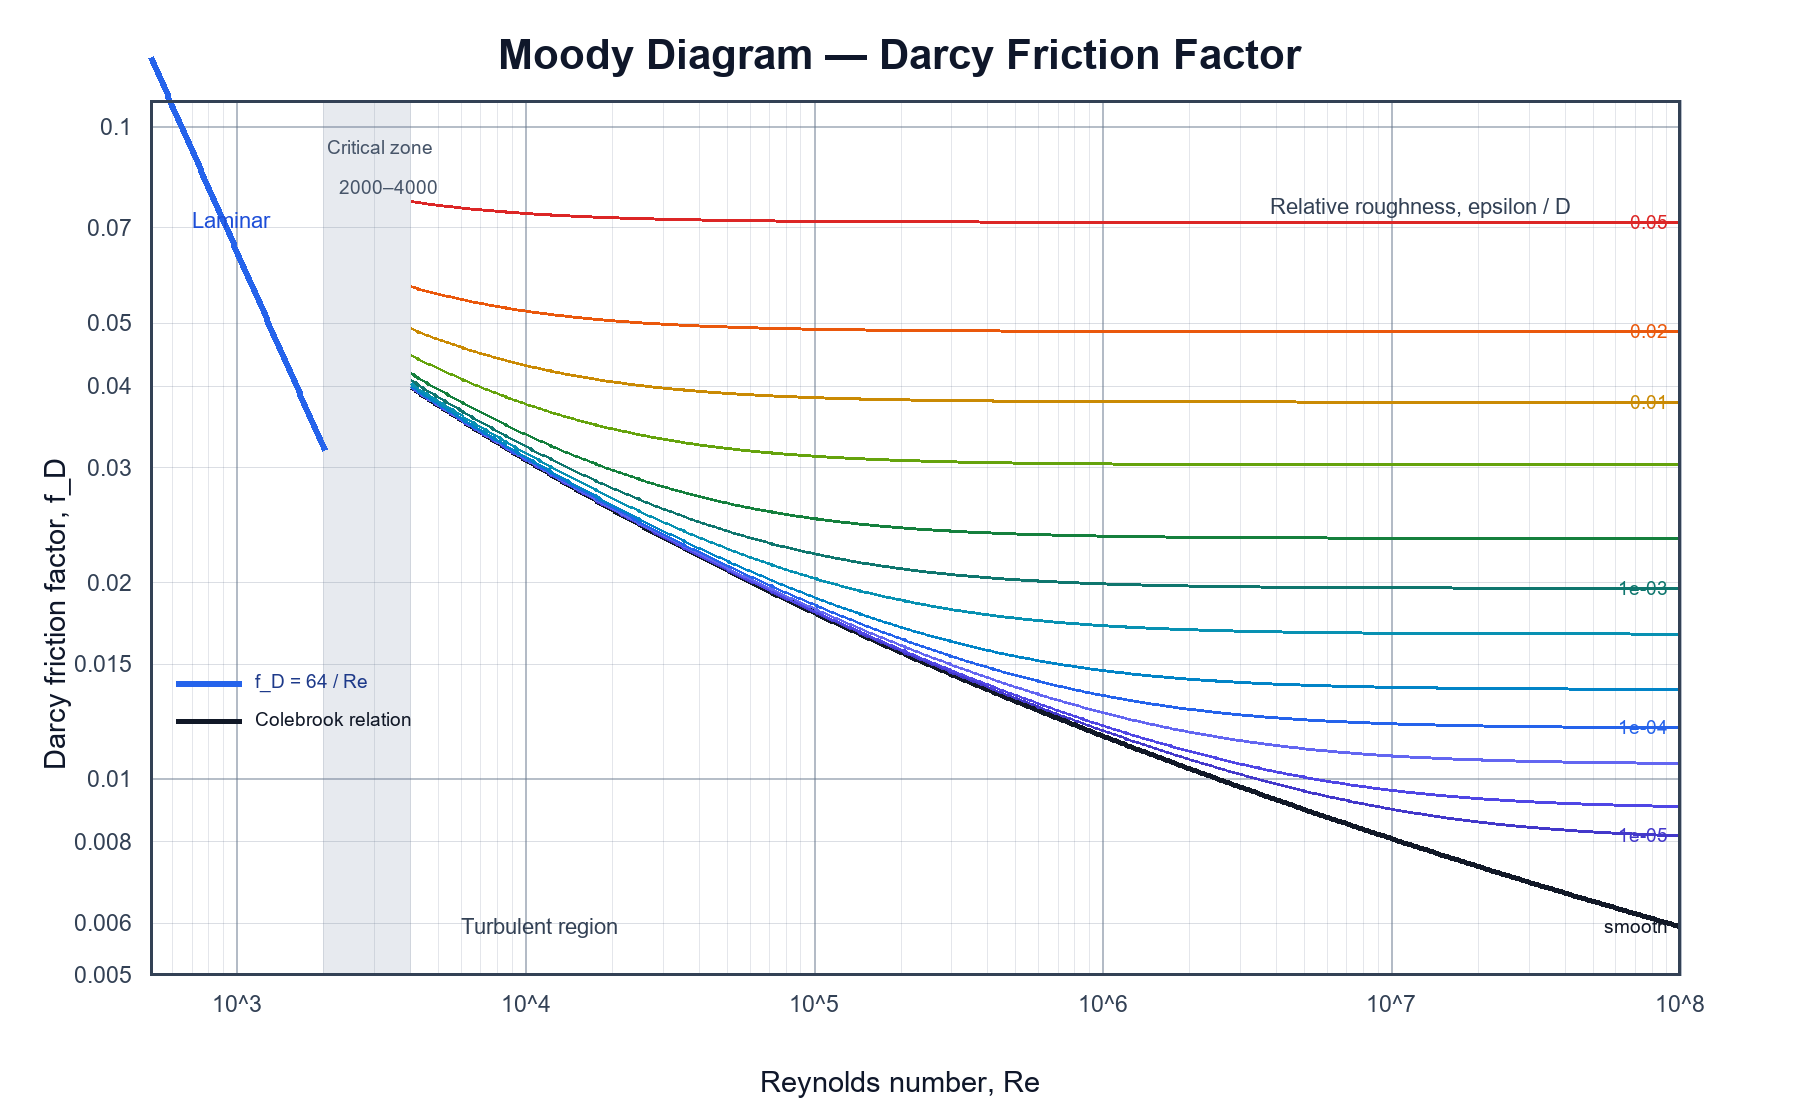
Re = ρuD/μ f_D = 64/Re f_F = 16/ReThe current model treats Re < 2000 as laminar. Do not directly extrapolate this relation to developing entrances, non-circular ducts, non-Newtonian fluids, or two-phase flow.
4. Development of the Moody diagram and Colebrook relation
Moody's 1944 chart was not a single new correlation, but a graphical synthesis of accepted pipe-resistance research: the laminar branch came from the Hagen–Poiseuille relation, rough-pipe behavior drew on Nikuradse's experiments, the implicit Colebrook relation connected smooth- and rough-pipe regimes, and Moody presented these results through the Darcy friction factor, Reynolds number, and relative roughness.
| Region | Range used here | Treatment |
|---|---|---|
| Laminar | Re < 2000 | f_D = 64/Re, independent of relative roughness. |
| Critical zone | 2000 ≤ Re ≤ 4000 | Flow is unstable; no universally unique friction-factor curve applies. |
| Turbulent | Re > 4000 | Depends on both Re and ε/D. |
Colebrook
1/√f_D = −2log₁₀[ε/(3.7D) + 2.51/(Re√f_D)]Colebrook is implicit and requires iteration. Explicit correlations primarily reduce repeated computation cost, but introduce approximation error relative to the selected reference.
5. Usage guidance
- Confirm whether the Darcy or Fanning convention is used.
- Check the Re and ε/D range over the entire tube calculation, not only at the inlet.
- Interpret critical-zone results cautiously and compare against experiments or an independent reference.
- After changing a correlation, rerun benchmark cases rather than comparing names alone.
6. Principal references
- Fang, Xu & Zhou, New correlations of single-phase friction factor for turbulent pipe flow and evaluation of existing single-phase friction factor correlations, DOI 10.1016/j.nucengdes.2010.12.019.
- Moody (1944), Friction Factors for Pipe Flow, DOI 10.1115/1.4018140.
- Colebrook (1939), Turbulent Flow in Pipes, DOI 10.1680/ijoti.1939.13150.